
No Tricks, Just Treats: Proven Savings for Every Industry
Table of Contents
No Tricks, Just Treats: Proven Savings for Every Industry
Is your organization haunted by double-digit health insurance increases? Are you tired of the yearly nightmare of cutting employee benefits to keep up with rising healthcare costs?
At The Difference Card, we're here to offer a sweeter alternative. We help employer groups save big on healthcare spend—without the spooky need to slash benefits. We’re not just filling your bucket with promises; we’re delivering treats of real savings across every industry.
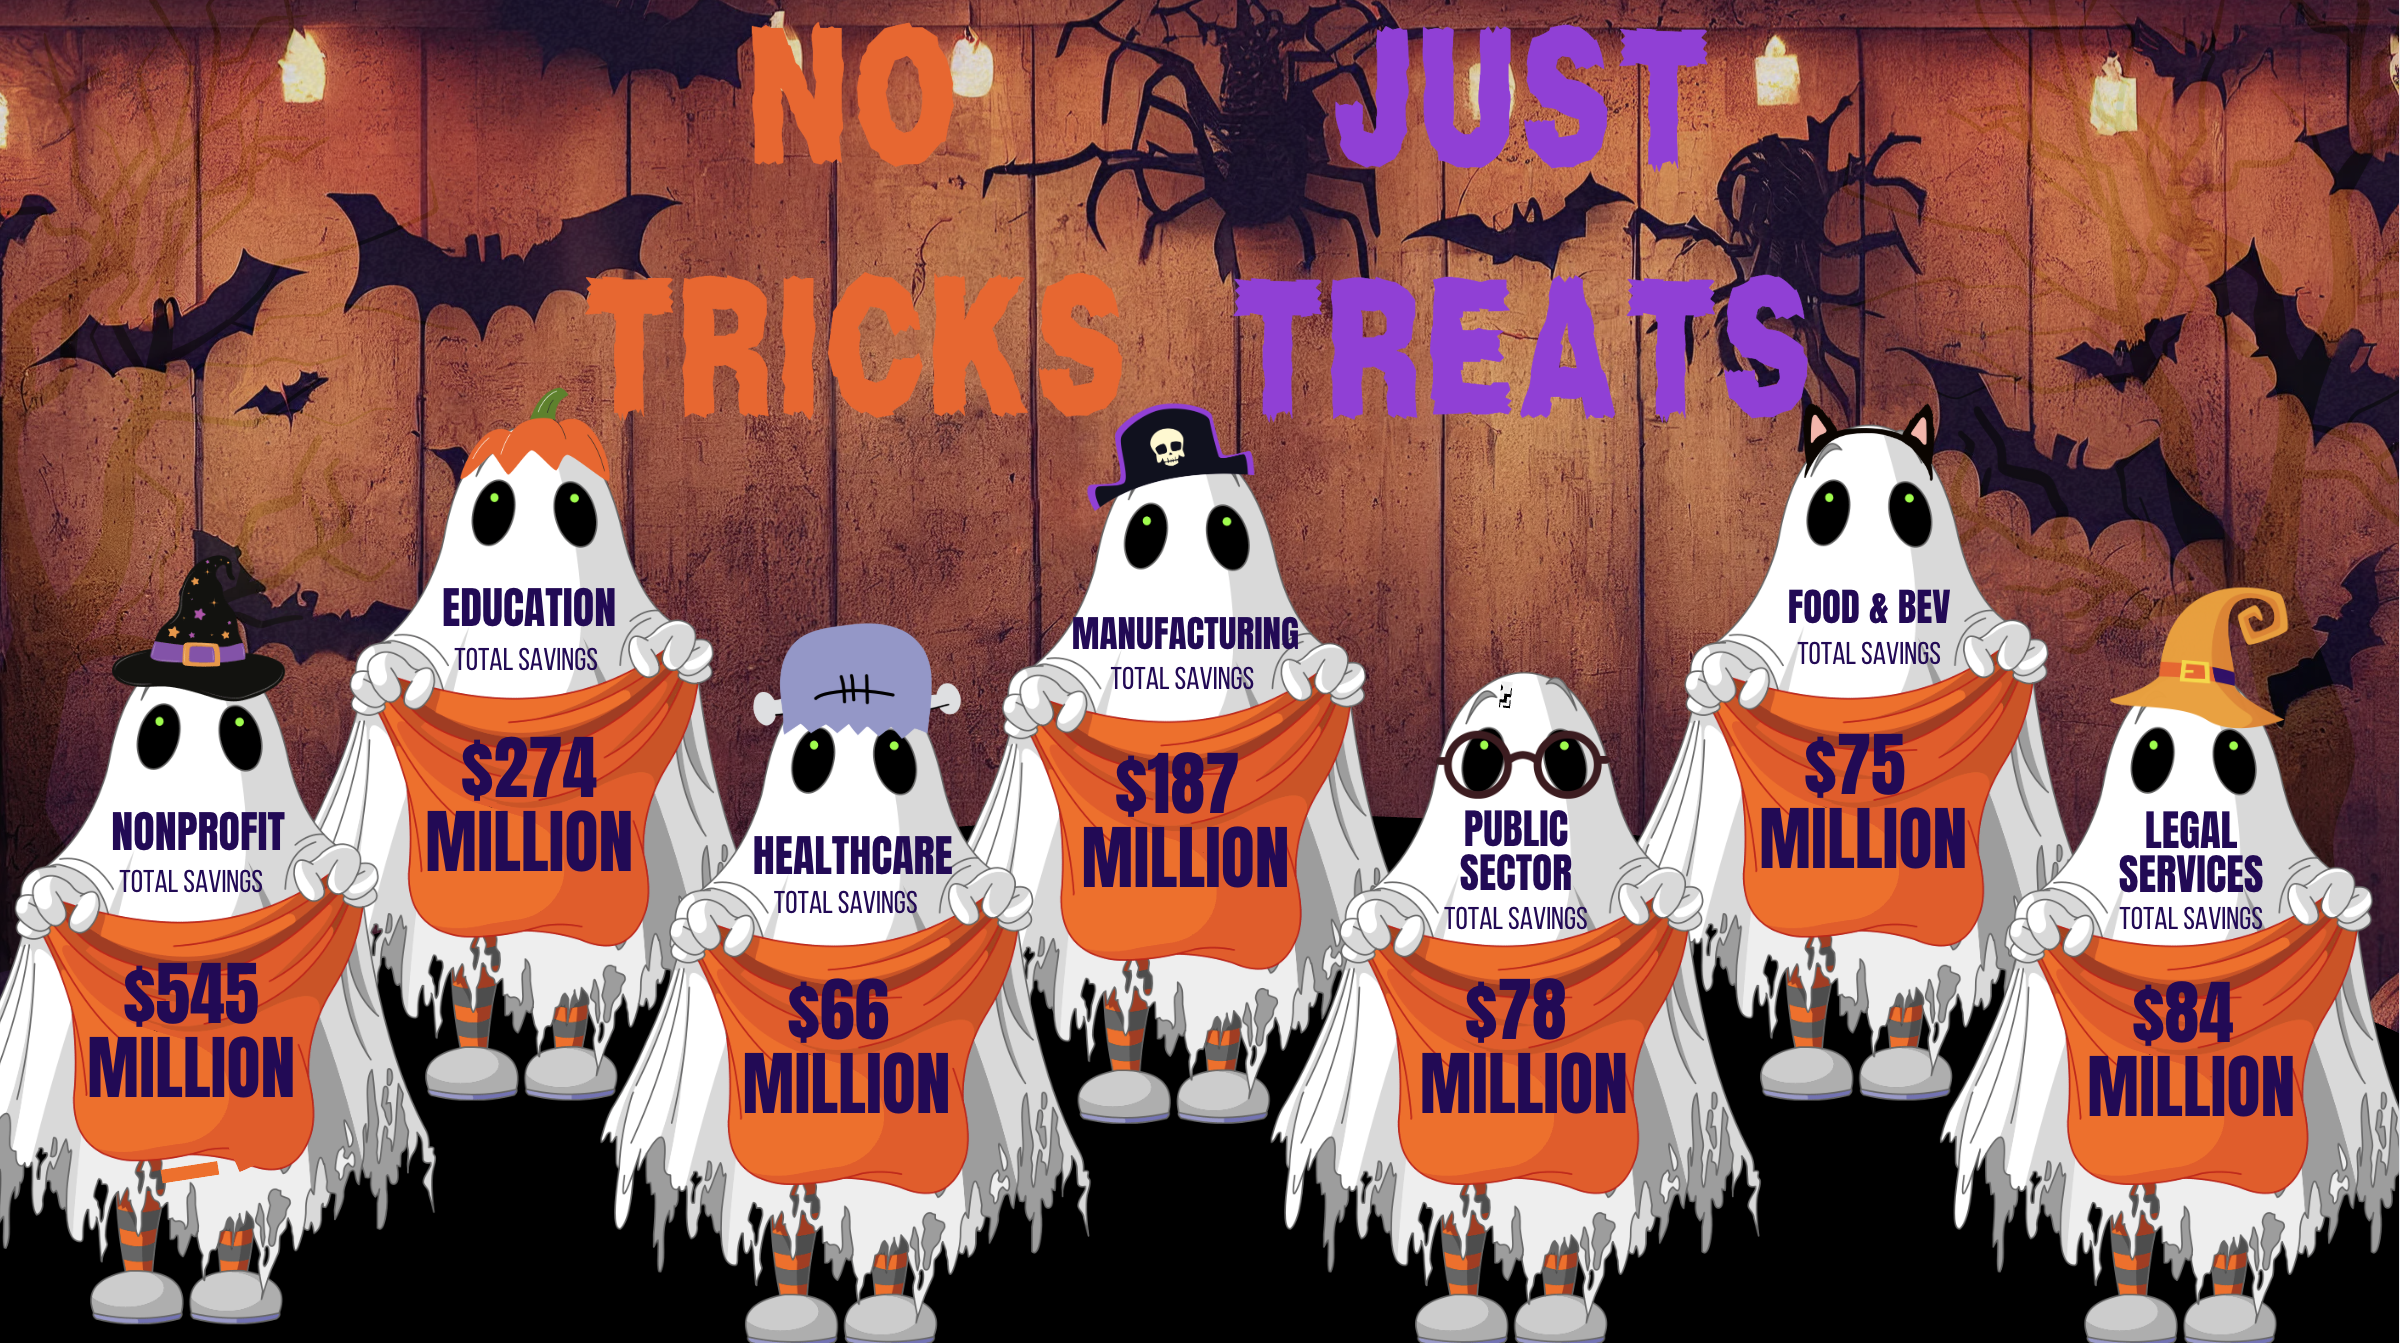
Discover the savings we were able to provide our various industries
Savings Provided by The Difference Card for Non-Profit Organizations:
Total Savings over 10 years: $545,526,866
Average Annual Savings per school: $411,097
Average savings per employee per year: $3,045
Average percent of savings per employee per year: 17.3%
See the savings for Non-Profit Partners

Savings Provided by The Difference Card for Education Organizations:
Total Savings over 10 years: $274,778,409
Average Annual Savings per school: $357,319
Average savings per employee per year: $3,659
Average percent of savings per employee per year: 17%
See the savings for Education Partners
Savings Provided by The Difference Card for Healthcare Systems:
Total Savings over 10 years: $66,758,508
Average Annual Savings per organization: $436,330
Average savings per employee per year: $2,261.77
Average percent of savings per employee per year: 15.2%
See the savings for Healthcare Partners

Savings Provided by The Difference Card for Manufacturing Organizations:
Total Savings over 10 years: $187,857,507
Average Annual Savings per organization: $210,839
Average savings per employee per year: $2,902.93
Average percent of savings per employee per year: 19.9%
See the savings for Manufacturing Partners

Savings Provided by The Difference Card for Public Sector Organizations:
Total Savings over 10 years: $78,665,813
Average Annual Savings per Organization: $409,717
Average savings per employee per year: $3,863.74
Average percent of savings per employee per year: 17.4%
See the savings for Public Sector Partners
Savings Provided by The Difference Card for Food and Beverage Services Organizations:
Total Savings over 10 years: $146,517,053
Average Annual Savings per Organization: $394,836
Average savings per employee per year: $3,332
Average percent of savings per employee per year: 19.4%
See the savings for Food & Beverage Partners
Savings Provided by The Difference Card for Legal Services Organizations:
Total Savings over 10 years: $84,568,875
Average Annual Savings per Organization: $213,557
Average savings per employee per year: $4,224.64
Average percent of savings per employee per year: 20.3%
No matter the industry, The Difference Card is committed to delivering real, measurable savings—no tricks, just treats. But don't just take our word for it—check out what our clients have to say and see the difference for yourself.
Ready to treat your organization to some sweet savings? Reach out to a consultant in your region or request a proposal today.